Total Revenue Test - Video Tutorials & Practice Problems
On a tight schedule?
Get a 10 bullets summary of the topic
1
concept
Total Revenue Test
Video duration:
9m
Play a video:
Now let's see how elasticity and demand relate to the concept of revenue. So revenue is the money that's coming in as companies sell stuff, right? When we sell stuff, we're gonna get revenue and we're gonna calculate our revenue, or should I say our total revenue, our total revenue is just gonna be the simple calculation of price times quantity. Right? So how much did we sell times at what price did we sell it? That's our revenue that we brought in, right. We sell 100 units for $10 each. Our revenue was $1000 100 times 10. So we're gonna use what's called the total revenue test when we're analyzing our changes in price. So what we want to, we want to do pretty much all the time in economics is maximize our revenue, right? We want to bring in as much money as possible. So we want to find the right price combination with demand. That's gonna do that for us, right? So we want to maximize total revenue, We need to find that point. So, for example, here, I've got this point on the graph where we've got a price of $50 and demand quantity demanded at that price is 1000 units. So let's go ahead and calculate total revenue in this case, right? Our total revenue pretty easy. Our price of $50 times the quantity of 1000. We're gonna get total revenue of $50,000 Right? So that's how we calculate total revenue. Pretty easy. You can also just calculated on the graph as the area of this rectangle right here, which would just be the 50 times the 1000 right? Pretty simple. That's our total revenue and that's how we see it on the graph. So let's go ahead and see how a change in the price, right? Right? Now we have a price of 50. But what if the price was different? What if we were to increase or decrease the price? How is that gonna affect our total revenue? Well, when we change the price, we're gonna have two effects on total revenue. The first we're gonna call the price effect, right? And this is the change in our total revenue based on it being a different price, right? Being selling the units at a different price. So the idea is let's say we increase our price, we're going to sell the units that we sell at a higher price. So we're going to make more money per unit because of this price effect, right? Because of the increased price and vice versa. Right? If we decrease the price, we would make less money per unit um based on this and that would be the price effect compared to the quantity effect. Right? So let's say we did have that increase in price, right? Well, when we increase the price, we could expect quantity demanded to decrease, right? So we're gonna see sell stuff at an increased price. That's the price effect. But we're gonna sell less stuff. That's the quantity effect, right? Or the opposite. If we decrease the price, we're gonna sell it at a less price the price effect. But we're going to sell more stuff. The quantity effect. Let's go ahead and see how that looks on the graph. Um So I'm gonna have three sections here. I'm gonna label it section one over here, Section two and section three um of of this graph. So let's go ahead and talk about the price effect and the quantity effect in this situation. So remember we had originally a price of $50 and a quantity demanded of 1000. Now management says, hey, I want to make more money, let's raise the price, $60. Um So at this price of $60 they're like, yeah, we're gonna make more money Except they forgot that when you raise the price, you're gonna have less quantity demanded, right? So this higher price of 60 cause quantity demanded to drop from 1000 to 800. Right? So let's see where's the price effect and where's the quantity effect? So first, let's talk price effect. Price effect is gonna be this box one, right? This area of box one is the price effect in this situation. The idea is that we're gaining this much in um in revenue because we increase the price, right? We're gonna get more revenue because we increase the price, we're gonna get more revenue per unit sold, I should say, right? So for each unit we sell we're going to get more money, $60 per unit instead of 50. That's the price effect. Is that extra $10 per unit gives us this little green area right here. But let's counter that with the quantity effect which is in box or yeah box three here um That is gonna be our quantity effect. And remember since we increased the price, we made more money per unit, right? We made an extra $10 per unit but we didn't sell 1000 units anymore. Now we sold only 800 units. So there's the quantity effect is that we actually lost revenue because we're not selling as many units as before. So that's going to counter act the price effect where we got more money for each unit. Unfortunately we didn't sell as many units. So there's gonna be a balance here. Um And the idea is which one was bigger was the price effect bigger than the quantity effect? That would have been a good thing for us, Right? Because we increased the price, we wanted the price effect to be big. We want to make more money per unit. And that to outweigh the units that we lost. So let's go ahead And calculate our total revenue in each case. And let's see if it was actually a good idea for management to raise the price. So let's start here with our original situation which we calculated above. And this was when our price was $50, right at that price of $50. Our total revenue was equal to our price times quantity, price being 50. Our quantity was 1000 in that situation. And at that price in quantity we had 50,000 in total revenue. And now let's see in the new situation, what happens? So in our new situation we raised the price to $60, right? And at this price of $60, let me just scoot out of the way here. Um at this price of $60, what was our total revenue? We sold them for 60 but we didn't sell 1000 this time we only sold 800. So 60 times 800, that's gonna give us 48,000 in total revenue. So in fact our total revenue decreased because of this price increase. Right? So we could say that the quantity effect in this situation was bigger than the price effect. And you can kind of verify that on the graph by seeing that the area of number three is bigger than the area of number one. And you can kind of do it just by counting basically the boxes in the area, you can kind of see that it's a bigger area there. But anyways, the idea here is that total revenue has decreased. So let's go ahead and define our elasticity based on what's happened to total revenue. So here we go. If this is the total revenue test right here, if total revenue increases when price increases, demand is in elastic. Alright, and the way I like to remember that is we've got total revenue increases, price increases in elastic, right? We've got that kind of um sequential thing going there, but I do want to note that everything here works in vice versa. So although that's true at the same time, if total revenue decreases when price decreases, then we're also in elastic. Right? So in both those situations it's still an elastic. Um So you just want to be careful with these vice versa, is that pop up all through economics? So let's go on to the next one when total revenue decreases as price increases. This is elastic in this situation. Okay. And remember it's also the opposite. So if we were to have total revenue increasing when price is decreasing, we would also have an elastic situation and last but not least if total revenue stays the same when price increases, demand is unit elastic. Right? So that is gonna be our last situation there. Um So what, what did we see in this graph? Was demand elastic or inelastic? Well, we raised the price and total revenue decreased, right? So if you look at our options there, that's gonna tell you that demand was elastic, right? It shows that the quantity effect was bigger than the price effect, right? The quantity demanded, um decreased more than the price was able to was was increasing, Right? So in the end, we have an elastic situation there on the graph at that point. Cool, So let's go ahead and go on to the next video at this point.
2
Problem
Problem
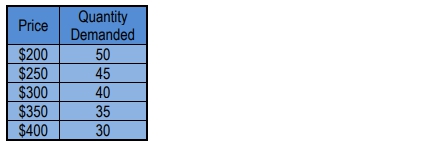
The following demand schedule relates to the market for computer chips. What happens to total revenue if the price falls from $400 to $350?
A
Total Revenue increases by $250
B
Total Revenue increases by $500
C
Total Revenue decreases by $250
D
Total Revenue decreases by $500
3
Problem
Problem
A price change causes the quantity demanded of a good to decrease by 20 percent, while the total revenue increased by 10 percent. The demand curve is: