Energy Diagrams - Video Tutorials & Practice Problems
On a tight schedule?
Get a 10 bullets summary of the topic
An Energy Diagram is a curved plot on a graph that Illustrates the energies of reactants, products and transition state as a reaction occurs.
Energy Diagram
1
concept
Energy Diagrams Concept 1
Video duration:
2m
Play a video:
Now an energy diagram represents a curved plot on a graph that illustrates the energies of reactivates products and transition state as a reaction occurs. Now we're going to stay here that are reactant, which we're going to abbreviate as our are found left in the beginning. So here, if we take a look at this energy diagram at the very beginning of the curve is this box which represents our reactant. We're going to say our products which will represent by P. Are found right at the end. So here at the very end of this curve, we have this last box here, so this represents our products. Then we're going to say our transition state which we're gonna abbreviate as T. S. This equals the max energy structure along a reaction coordinate between reactions and products. So the top of the curve that is our transition state. So T. S. Now sometimes it's referred to as also the activated complex. Get to your transition state, activate complex are the same thing we're gonna say, our reaction coordinate is just the progress of a reaction that lies along the X axis. So here are why access is looking at the change in energy starting out at 80 killer jewels and going up all the way up to 200. And this is on our Y axis, are X axis is here and this is our reaction progression. Okay, so our reaction coordinate. Okay, so this is our reaction coordinate. It's looking at the lifetime of lifespan of the reaction as you go from reactant in the beginning to products at the end and everything in between now we're gonna stay here that are activation energy. Also referred to as our energy barrier. I'm gonna abbreviate it as E sub. This is just the minimum energy required for reaction to occur. So we're gonna say here that the height, the difference in height to the reacted line that represents our activation energy or energy barrier. Okay, so when we're looking at the very top of the hill to down here where the reactions are, that is our activation energy. So just keep in mind these are the most fundamental and most important parts of any energy diagram that you'll come face to face with.
2
example
Energy Diagrams Example 1
Video duration:
37s
Play a video:
What is the energy value for the product within the following energy diagram? So here we have our curve, Remember at the end of the curve that's where our product resides. So here at the end this is where our product resides on this part of the curve. All we have to do now is trace it back to the Y axis and see what value is connected to it. So here we say that the product line of our energy diagram Resendes at 140 killer jewels in terms of energy. So the energy value for our products within this particular energy diagram is 140 killer jewels.
3
concept
Energy Diagrams Concept 2
Video duration:
2m
Play a video:
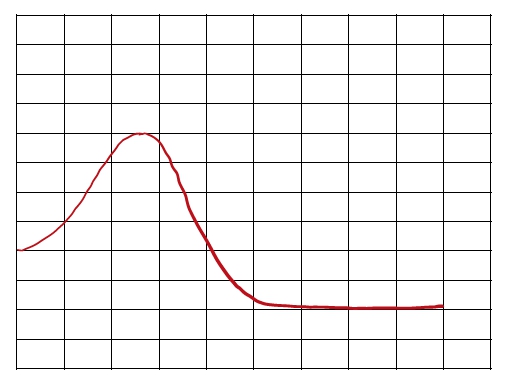
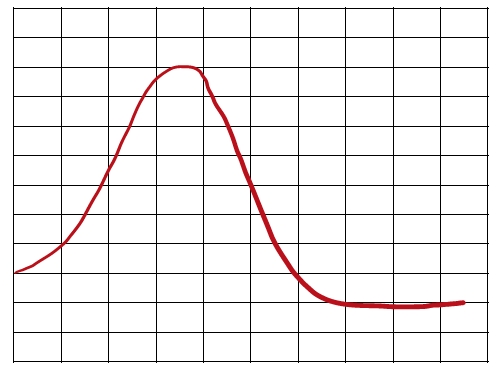
the speed of a chemical reaction is based on the height of the activation energy. And we're going to say here that activation energy, which is abbreviated as ss of a equals your transition state minus your reactant line. Mhm. Remember when we're looking at any particular energy diagram, the top of the curve is our transition state and where the curve starts, that's where our reactions are initially. Mhm. So we're gonna say here that the higher the activation energy than fewer reacting molecules have enough energy to convert into products. Remember that the difference in height between your transition ST anger react in line, that represents your activation energy. So if we look at both of these, mm So this will be our activation energy. So basically we're gonna say the higher your activation energy and the slower the reaction. And we're gonna say the smaller your activation energy and the faster the reaction. If we take a look here at these two reactions, remember we just said that activation energy equals transition state minus to react in line. So in this first curve, our transition state looks like your resides on this line here, which is 90 minus a reactive line. You're reacting line here reside at 20. So the difference here is 70 killed jules. So that's the minimum energy required for our reactions to traverse this curve and hopefully become products over here are transition state is 60 And are reacting line is still 20. So that's 40 killer jewels. Remember we just said that the larger your activation energy, they'll slower your reaction. So we'd say that the first graph is our slower reaction. The second graph has a smaller activation energy. So this is our faster reaction. Right? So just keep in mind that your energy of activation or activation barrier, this basically determines how faster reaction will go. The higher your area is, the slower the reaction. The smaller yuri a b faster the reaction
4
example
Energy Diagrams Example 2
Video duration:
43s
Play a video:
Which reaction will occur in the shortest amount of time. We have a reaction a, which has an activation energy of 143 killer jewels reaction be, which has an activation energy of 80 killer jewels, and, finally, reaction C, which has an activation energy of 2 15 killer jewels. So we want the shortest amount of time. That means the one that occurs the fastest. Remember we said that the smaller activation energy, the faster the reaction will go. So we'd say that option B reaction being has the smallest activation energy, which would translate to the fastest chemical reaction, which would translate to the shortest amount of time. Okay, so Option B is the correct answer.
5
concept
Energy Diagrams Concept 3
Video duration:
3m
Play a video:
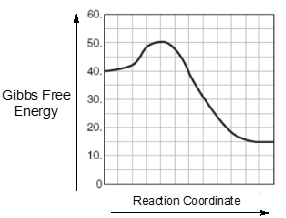
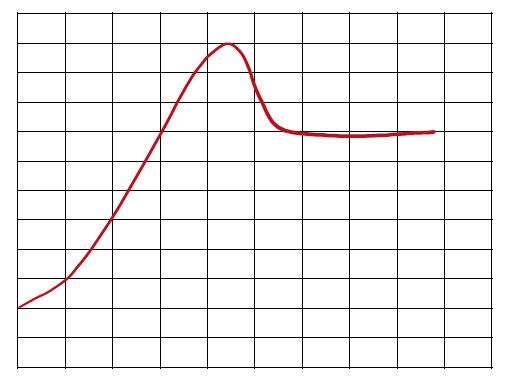
the difference in overall energy between the reactions and products can determine the favorability of a reaction. We're gonna say overall energy is represented by the symbol delta E. And it equals products. So the product line minus react. It's the reactant line we're gonna say connected to this idea of overall energy. We can talk about entropy and Gibbs free energy, specifically entropy, which is delta H. This is when the overall energy is classified as thermal energy because when we say overall energy, it could be nuclear, it could be solar, it could be cosmic, it could be all types of energy. When we say entropy, we're talking specifically about thermal energy energy on dealing with heat. Now Gibbs free energy is delta G. This is when the overall energy is connected to the favorability of product formation. If you're able to make products in your chemical reaction, that's a good thing. That means a chemical reaction is favorable. That's the whole point of chemical reactions to change reactant into products. Now, if we take a look here at our energy diagrams, we're going to say that Delta, you remember we said is products minus reacted. So here's your product line, Here's your react in a line. Here's your product line, here's your reactive line. So its products minus reacting. The product line looks like it's around 15. The reacting line looks like it's around 40. So that's -25. We could say killer jewels as the standard units. Now remember, Delta is the umbrella term. But this side here could easily say gibbs free energy, it could say anthropocene, it doesn't matter. They're all types of energy. They all would have the same type of value. So this would also be -25. This would also be -25. When Delta H. Is negative, it is Excel thermic, Excel thermic is energy releasing. Mhm. When DELTA T. Is negative, it's X. Organic. This is favorable in product forming because your products have lower energy. Their energy is 15 killer jewels in chemistry. Lower energy means greater stability. That's a good thing. Go to the other side. Products - Reactions. It looks here that my product line is around 50. My reacting lines around 30. So that's a positive 20. This would also be positive if the energy here was specifically thermal energy And this would be positive 20 as well. If this was Gibbs free energy when it's positive, it's endo thermic for Delta H. Which means energy absorbing. The reactions absorb energy. And that's why my products at the end have more energy here at delta G. Is positive. It's called undergone IQ. This is not favorable. You don't want to end with products that have more energy than your reactions. Did. More energy is less stable. So keep this in mind when we talk about overall energy, that's an umbrella term, and when we want to be more specific, we can go into entropy or gibbs free energy.
6
Problem
Problem
Which of the following statements is true regarding the energy diagram provided?
i. The reaction is endothermic. ii. The activation energy is +10 kJ. iii. The reaction releases energy. iv. The enthalpy of the reaction is –25 kJ.
A
I only
B
II and IV
C
I and III
D
II, III and IV
7
Problem
Problem
Which of the following reactions proceeds the slowest?