Lock and Key Vs. Induced Fit Models - Video Tutorials & Practice Problems
On a tight schedule?
Get a 10 bullets summary of the topic
1
concept
Lock-and-Key Vs. Induced Fit Models
Video duration:
4m
Play a video:
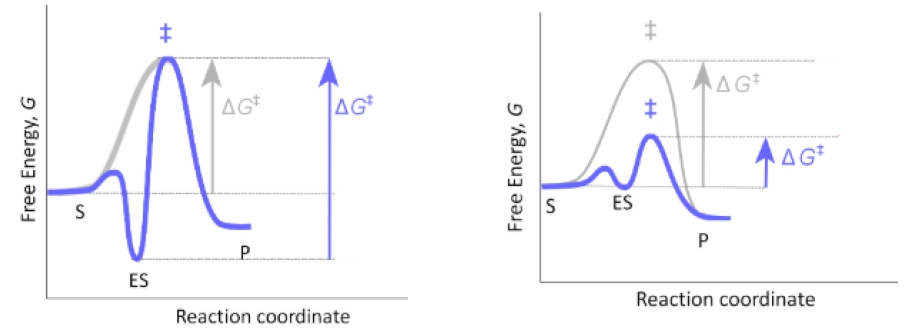
in this video, we're going to begin our discussion on the lock and key and the induced fit models. So it turns out that there are two main models for enzyme substrate, specificity or two main models for how the enzyme interacts with the substrate toe form the enzyme substrate complex. And so the first main model is the lock and key model, whereas the second main model is the induced fit model. And so in this video, we're on Lee going to talk about the lock and key model. But in our next lesson video, we'll talk about the induced fit model. And so, with the lock and key model, the shape of the active site on the enzyme is rigid and perfectly complementary to the substrates shape. And so what this means is that in the lock and key model, the shape of the active site is perfectly suited to the shape of the substrate to create a perfect puzzle piece like fit. And so if we take a look at our example down below of the lock and key model, notice that our enzyme is in purple here, and our substrate is this key shape here and so in the lock and key model, the substrate acts as the key, and the enzyme acts as the lock. And in the lock and key model. The active site of the enzyme takes on a shape that is perfectly complementary to the shape of the substrate. So when the enzyme substrate complex forms over here, you can see that the substrate fits into the active site like a perfect puzzle piece like fit. And so there's no need for the enzyme or the substrate toe have to change confirmations in order for the enzyme substrate complex to form. And so, ultimately, what this means is that in the lock and key model, the enzyme substrate complex that forms is going to be very, very stable, almost way to stable in some cases. And so over the years, the lock and key model has actually become a less likely model for enzyme catalysis. And this has to do with the fact that the enzyme substrate complex become so stabilized with this lock and key model. And ultimately, the stabilization of the enzyme substrate complex leads to the energy of activation, either staying exactly the same or even potentially increasing in comparison to the uncapped allies. Reaction and recall. That's the exact opposite effect that we want. Enzymes toe have on reactions. We want enzymes to decrease the energy of activation, not Thio. Keep the energy of activation the same or even increase them. And that is again why the lock and key model is a less likely model. So let's take a look down below at our energy diagram that we have of the lock and key model, where we have the free energy on the Y axis and the reaction coordinate on the X axis and notice that the dotted line curve right here represents the uncapped allies reaction. Whereas the red curve here represents the enzyme catalyzed reaction and notice that this black line right here this black arrow represents the energy of activation for the uncapped allies reaction and typically enzymes air supposed to decrease the energy of activation for a reaction. But notice that the enzyme catalyzed activation energy represented by this red arrow here is pretty much exactly the same size as the uncapped allies. Energy of activation. And that has to do with the fact that the lock and key model stabilizes the energy the enzyme substrate complex, the energy of the enzyme substrate complex. And so this low low energy of the enzyme substrate complex ultimately leads to the energy of activation. This energy barrier represented by this red arrow here, uh, being exactly the same size or becoming even larger depending on how well this transition state is stabilized. And so, ultimately, this is why the lock and key model is a less likely model for enzyme catalysis. And so, ah, mawr, likely model for enzyme catalysis is the induced fit model, which we'll talk about in our next lesson video. So I'll see you guys there.
2
concept
Lock and Key Vs. Induced Fit Models
Video duration:
4m
Play a video:
So in our last lesson video, we said that the lock and key model is a less likely model for enzyme substrate specificity in, um, or likely model for enzyme substrate. Specificity is the induced fit model, which is what we're going to talk about in this video. And so with the induced fit model. Unlike the lock and key model, the shape of the active site on the enzyme is not rigid. It's actually adjustable. And instead of being perfectly complementary to the shape of the substrate, the active sites shape is actually mawr complementary to the transition state than it is to the shape of the substrate. And ultimately, this is what allows the enzyme to prioritize stabilizing the transition state over stabilizing the enzyme substrate complex like what happens with the lock and key model. And so as we'll see down below, in our example with the induced fit model, there are confirmation will changes that take place and are induced, and both the enzymes active site and the substrate. And so if we take a look at our example of the induced fit model down below, notice that we have the enzyme over here in purple And then we have our square shaped substrate over here in orange and notice that with the induced fit model, the active site shape is not perfectly complementary to the shape of the substrate. And instead, the active site shape is mawr, complementary to the transition state. And so when the substrate forms of complex with the enzyme, notice that there are confirmation all changes that are induced in both the enzymes active site and the substrate. So notice that the substrate here the square shaped, square shaped substrate, has changed confirmations to this rectangular shaped substrate and also noticed that the enzymes active site is Mawr opened up and has essentially changed confirmations. And so, ultimately, what happens when the enzyme substrate complex forms in the induced fit model is that the enzyme substrate complex is not stabilized like it was with the lock and key model. Instead, the transition state is stabilized even more so than the enzyme substrate complex. And so, ultimately, what this means is that the transition state stabilization is prioritized with the induced fit model, and that is ultimately what makes the induced fit, model, aim or likely model for enzyme catalysis. And this again has to do with the fact that the enzyme substrate complex is not stabilized like it is with the lock and key model. And when the transition state is stabilized and prioritized. Ultimately, what happens is there's a decrease in the energy of activation. And that's exactly what we want enzymes to dio. And that's why the induced fit model is mawr likely. And so if we take a look down below at our energy diagram of the induced fit model, notice that we have the free energy on the Y axis and the reaction coordinate on the X axis. And again we have this dotted line here that represents our uncapped allies reaction. Whereas the Red Line represents the enzyme catalyzed reaction and notice that the arrow here the Black Arrow represents the energy of activation for the uncapped allies reaction, which is pretty large here and noticed that the Red Arrow this time is representing the catalyzed energy of activation. And it's actually smaller than the uncapped allies Energy of activation, which means that the reaction is going to be sped up. And so the reason that we're able to get a smaller energy of activation for the catalyzed reaction is because notice that the enzyme substrate complex is not as stabilized as it was with the lock and key model, and that allows for us to just stabilize the transition state and keep the energy of activation for the catalyzed reaction relatively small instead of staying the same or potentially increasing, like it did with lock in chemo. And so it's important to note moving forward in our course as we talk about enzymes, that the induced fit model is a mawr likely model for enzyme catalysis. And so that concludes our lesson on the induced fit model, and I'll see you guys in our next video, where we'll be able to get a little bit of practice.
3
Problem
Problem
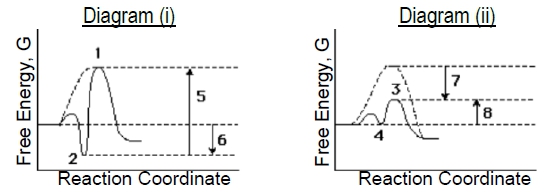
Compare the two enzyme-catalyzed reaction diagrams below (i & ii) to determine which of the following is true.
a) The ES-complex in diagram (i) is #2 and in diagram (ii) is #3..
b) Catalyzed EA in diagram (i) is arrow #5 and in diagram (ii) is arrow #7.
c) Binding energy in diagram (i) is arrow #5 and in diagram (ii) is arrow #7.
d) Diagram (i) describes a 'lock & key' model while (ii) describes more of an 'induced fit' model.
A
The ES-complex in diagram (i) is #2 and in diagram (ii) is #3.
B
Catalyzed EA in diagram (i) is arrow #5 and in diagram (ii) is arrow #7.
C
Binding energy in diagram (i) is arrow #5 and in diagram (ii) is arrow #7.
D
Diagram (i) describes a 'lock & key' model while (ii) describes more of an 'induced fit' model.
4
Problem
Problem
What is a potential disadvantage for an enzyme having too high of an affinity for its substrate?
A
Enzyme catalysis may not occur.
B
The enzyme would catalyze the reaction but remain covalently & permanently linked to the product.
C
The ES complex could end up in a large energy trough with a consequentially large EA to the transition state.
D
There's no potential disadvantage to strong affinity. The stronger the affinity, the faster/better the catalysis.
E
a, b and c.
F
a and c.
5
Problem
Problem
Select the best option that fills in the blanks appropriately in the order of their appearance.
The left graph depicts an energy diagram for the '_____________' model of enzyme-substrate specificity, whereas the right diagram depicts an energy diagram for the modern '_____________' model. In the lock & key model, the enzyme binds tightly and precisely to the '_____________.' In the induced fit model, the enzyme binds weakly to the '_____________' and then changes conformation to bind tightly to the '_____________.'
A
Lock & Key ; Induced fit ; transition state ; substrate ; product.
B
Lock & Key ; Induced fit ; substrate, transition state ; product.