4 & 5. Statistics, Quality Assurance and Calibration Methods
Analysis of Variance (f-Test)
4 & 5. Statistics, Quality Assurance and Calibration Methods
Analysis of Variance (f-Test) - Video Tutorials & Practice Problems
On a tight schedule?
Get a 10 bullets summary of the topic
An F-Test is used to compare 2 populations' variances.
F-Test
1
concept
F-Test
Video duration:
2m
Play a video:
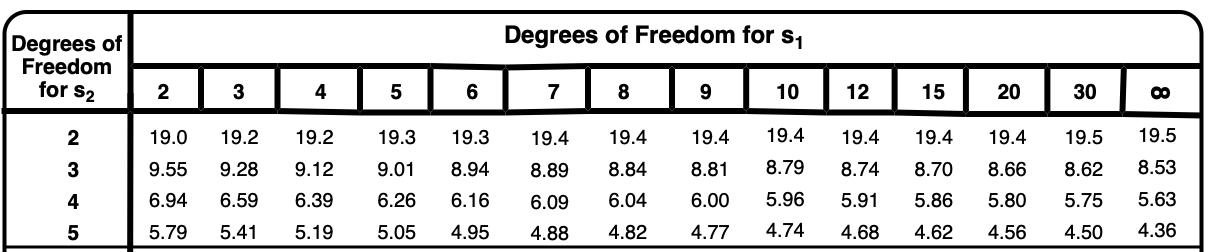
So when we're dealing with the F test, remember the F test is used to test the variants of two populations. And remember that variance is just your standard deviation squared. Now we're gonna say F calculated, represents the quotient of the squares of the standard deviations. Here it is standard deviation one squared divided by standard deviation two squared. We're gonna say when calculating our f quotient. Uh So basically this value always set the larger standard deviation as the numerator. So that way F calculated will always be equal to or greater than one. Now we're gonna say here, we can compare our f calculated value to our F table value to determine if there is a significant difference based on the variances here, we're gonna say if your F calculated is less than your F table, then the difference will not be significant. So here we say that they would have equal variances and as a result, our t calculated in s pulled formulas would be these two here here, X one is just the measurements, the mean or average of your first measurements minus the mean or average of your second measurements divided by s pulled and it's just the number of measurements. So population one has this set of measurements. Population too has its own set of measurements here. If you're f calculated is greater than your F table and there is a significant difference. So we're gonna say here, you're you have unequal variances, which would mean that you'd use a different set of values here, this would be the equation to figure out t calculated and then this would be our formula to figure out your degrees of freedom. Remember we've seen these equations before in our exploration of the T. Test, and here is our F. Table, so your degrees of freedom for standard deviation one, which is the larger standard deviation. And these are your degrees of freedom for standard deviation. To just like with the tea table, you just have to look to see where the values line up in order to figure out what your T. Table value would be. And then compared to your F. We'll figure out what your F. Table value would be, and then compare it to your F calculated value. As we explore deeper and deeper into the F test. You'll see how we use this particular chart with questions dealing with the F. Test.
F-Test Calculations
2
example
F-Test Calculations 1
Video duration:
5m
Play a video:
in the process of assessing responsibility for an oil spill. Two possible suspects are identified to differentiate between the two samples of oil. The ratio of the concentration for two poly aromatic hydrocarbons is measured using fluorescent spectroscopy. These values are then compared to the sample obtained from the body of water. So we have information on our suspects and the and the sample we're testing them against. So we have the averages or mean the standard deviations of each and the number of samples of each here are asked from the above results, Should there be a concern that any combination of the standard deviation values demonstrates a significant difference? Alright, so here they're asking us if any combinations of the standard deviations would have a large difference, so to be able to do that, we need to determine what the F calculated would be of each combination. And if the F calculated happens to be greater than our f table value, then we would say there is a significant difference. So here to be able to do that, we're gonna figure out what our degrees of freedom are next for each one of these, It's 4° of freedom. Remember your degrees of freedom are just the number of measurements, N -1. So this would be 4 -1, which is 34 and five. We'll use that later on with this table here. Now, to figure out our f calculated, we're gonna say F calculated equals standard deviation one squared divided by standard deviation. Two squared. Remember the larger standard deviation is what goes on top. So that F calculated is always a number equal to or greater than one. So here we're using just different combinations. So I'll compare first these 2-1 another, so larger standard deviation on top squared, Divided by smaller one squared When I do that, I get 1.588-9. Next we're going to do S one squared divided by S two squared equals. So I did those two. Now I'm gonna do this one and this one so larger. Standard deviation again on top, divided by what's on the bottom, So that gives me 1.45318. Now for the last combination that's possible. So that would be between these two, so S one squared over S two squared equals 0.92 squared divided by 0.88 squared, So that's 1.09298. Now these represent our f calculated values. All we have to do is compare them to the f table values. So for the first enter deviation S one which corresponds to this, it has a degree of freedom of four And then this one has a standard deviation of three, So degrees of freedom for S one, so we're dealing with four And for S two it was three, they line up together to give me 9.12. So for this first combination, F table equals 9.12 comparing F calculated to f. Table if F calculated is greater than F. Table, there is a significant difference here, My f table is 9.12 and my f calculated is only 1.58 and change, So you're gonna say there's no significant difference. Mhm. Next one. So here, standard deviation of .088 is associated with this degree of freedom of five, and then we already said that this one was three, so we have five, and then three, they line up right here, so F table equals 9.1. Again, F table is larger than F calculated, so there's still no significant difference, and then finally we have here, this one has four degrees of freedom. This one here has 5° of freedom, so we'll see where they line up, So S one is 4 And then as two was 5, so they line up right there. So f table here Equals 5.19. So we'd say in all three combinations, there is no significant difference because my F calculated is not larger than my F table now, because there is no significant difference. This will play a role in determining which formulas to use, for example, to so you can attempt to do example, to on your own from what you know at this point, based on there being no significant difference in terms of their standard deviations. Don't worry if you get lost and aren't sure what to do Next, just click over to the next video and see how I approach example, too.
3
example
F-Test Calculations 1
Video duration:
8m
Play a video:
So an example to its states can either or both of the suspects be eliminated based on the results of the analysis at the 99% confidence interval. Now realize here because an example one we found out there was no significant difference in their standard deviations. That means we're dealing with equal variance because we're dealing with equal variance. This dictates what version of S pulled and T calculated formulas will have to use now since there's gonna be a lot of numbers guys on the screen, I'll have to take myself out of the image for a few minutes. So let's look at suspect one and then we'll look at suspect two and we'll see if either one can be eliminated. So for suspect one again, we're dealing with equal variance in both cases, so therefore as pooled equals square root of S one squared times N one minus one plus S two squared times and two minus one Divided by N one Plus N two minus two. Alright, so for suspect one, we're comparing the information on suspect one. So the information on suspect one to the sample itself. So we'll be using the values from these two for suspect one. So we'll come back down here and before we come back actually we're gonna say here because the sample itself. Alright, so we're gonna stay here for we can say here that we'll make this one S one and we can make this one S two, but it really doesn't matter in the grand scheme of our calculations. So we come back down here, We'll plug in as S one 0.73 squared times the number of samples for suspect one was four minus one plus the standard deviation of the sample which is 10.88 squared the number of samples for the um the number of samples for the sample was six minus one, Divided by 4 6 -2. When we plug all that in, that gives a square root of .006838. And that comes out to a .0826944. S pulled. Now that we have s pulled we can figure out what T calculated would be so t calculated because we have equal variance equals in absolute terms X one average X one minus X two divided by s pool Times and one times and two over and one plus end to. So the meaner average for the suspect one is 2.31 And for the sample 2.45 we've just found out what S pool was. So plug that in Times the number of measurements, so that's four times six, divided by 4-plus 6. So all of that gives us 2.62277 for T. calculated. Now if if t calculated is larger than tea table then there would be significant difference between the suspect and the sample here. Um If you use a tea table our degrees of freedom Is normally N -1 but when it comes to comparing the 2-1 another, my degrees of freedom now become this and one plus and 2 -2. So that would be four Plus 6 -2, which gives me a degree of freedom of eight. So if you go to your tea table, look at eight for the degrees of freedom and then go all the way to 99% confidence, interval. that gives us a tea table value Equal to 3.355. So what is this telling us? Well what this is telling us? It's telling us that our t calculated is not greater than our tea table tea tables larger tea table is this? And calculators only. This. So that means there is no significant difference. Yeah. Mhm Between suspect one in the sample. So that would mean that suspect one is guilty of the oil spill because T calculated is less than T table, there's no significant difference. So, suspect one is a potential violator. Now let's look at suspect too. So suspect two, we're gonna do the same thing as pulled equals same exact formula but now we're using different values. Were comparing suspect two now to the sample itself, So suspect too has a standard deviation of .092, which will square times its number of measurements, which is 5 -1 plus the standard deviation of the sample. And that's also squared it had 66 samples minus one, divided by five plus six minus two. So here that give us square root of .008064. So that equals .08498 .0898. Not that we have as pulled we can find t. calculated here Which would be the same exact formula we used here. So here the mean of my suspect two is 2.67 -2.45. Yeah, divided by my s pulled which we just found times five times six, divided by five plus six. So that's 2.44989 Times 1.65145. So T calculated here equals 4.4586. My degrees of freedom would be five plus six minus two which is nine. So we look up 94 degrees of freedom. We go all the way to 99 confidence interval. So T table Equals 3.250. So in this example T calculated is greater than tea table. So that means there a significant difference mhm Between the sample and suspect two which means that they're innocent. So in this example which is like an everyday analytical situation where you have to test crime scenes and in this case an oil spill to see who's truly responsible. We can see that suspect one. There was no significant difference because T calculated was not greater than tea table. So suspect one is responsible for the oil spill, suspect to its T calculated was greater than tea table, so there is a significant difference, therefore exonerating suspect too. So again, if we had had unequal variance, we'd have to use a different combination of equations for as pulled and T calculated, and then compare T calculated again to tea table. So again, F test really is just looking to see if our variances are equal or not, and from there, it can help us determine which set of equations to use in order to compare T calculated to T. Table.
4
example
F-Test Calculations 2
Video duration:
3m
Play a video:
Yeah, here it says you are measuring the effects of a toxic compound on an enzyme, you expose five test tubes of cells to 100 micro liters of a five parts per million. A quick solution of the toxic compound. And mark them as treated and expose five test tubes of cells to an equal volume of only water and mark them as untreated. You then measure the enzyme activity of cells in each test tube, enzyme activity in this case is in units of micro moles per minute. Here. The following other measurements of enzyme activity. Alright, so we're given here two columns. We have our enzyme activity that's been treated and enzyme activity that's been untreated. We have five measurements for each one from this. Were able to obtain our average or mean for each one were also given our standard deviation. Now, this question says, is the variance of the measured enzyme activity of cells exposed to the toxic compound equal to that of cells exposed to water alone. Alright, so, we know that variants. If we're trying to compare the variance between two samples or two sets of samples, that means we're relying on the F. Test. What we have to do here is we have to determine what the F calculated value will be. Remember F calculated equals S one squared divided by S two squared S one. The one on top is always the larger standard deviation. So that means that our F calculated at the end Must always be a value that is equal to or greater than one. So here are standard deviations for the treated and untreated. So we always put the larger standard deviation on top again, so .36 squared Divided by .29 Squared When we do that, it's gonna give me 1.54102 as my f calculated. What I do now is remember on the previous page where we're dealing with f tables, we have five measurements for both treated untreated, and if we line them up perfectly, that means our f table Would be 5.05. All we do now is we compare our f table value to our f calculated value. So here F calculated is 1.54102. F table is 5.5. If f table is greater than F calculated, that means we're gonna have equal variance. So that just means that there is not a significant difference. Okay, so since there's not a significant difference, this will play a major role in what we do in example, example to so work this example to out if you remember when your variances are equal, what set of formulas do we use if you still can't quite remember how to do it or how to approach it. Just click on to the next video and see how I answer. Example too
5
example
F-Test Calculations 2
Video duration:
5m
Play a video:
All right guys, because we had equal variance an example, one that tells us which series of equations to use to answer, example to. So here it says the average enzyme activity measured for cells exposed to the toxic compound significantly different at 95% confidence level. Um That then that can be measured for cells exposed to water alone. Uh Because we're gonna have to utilize a few equations, I'm gonna have to take myself out of the image guys but follow along again. We had equal variants according to example, one that tells me that I have to use T calculated and we're gonna use the version that is equal to Absolute value of average 1 - Average two divided by s pulled times square root of n one times N two, divided by n one plus N two. And then here, because we need s pulled s pulled in this case what equal square root of standard deviation one squared times the number of measurements minus one plus Standard deviation two squared number of measurements minus one Divided by N one Plus N 2 -2. Now, we're used to seeing the degrees of freedom as being n minus one, but because here we're using two sets of data are new degrees of freedom actually becomes N one plus N two minus two. All right, now we have to do is plug in the values to get r t calculated. Alright, so let's first figure out what s pulled will be so equals so up above we said that our standard deviation one, which is the larger standard deviation is 10.36. That'll be squared number of measurements is five minus one plus smaller deviation is s 2.29 squared five minus one, divided by five plus five minus two. So when we take when we figure out everything inside that gives me square root of 0.10685. Taking the square root of that gives me an S pulled Equal to .326879. So that's my s pulled. So that's gonna go here in my formula. So here t calculated equals 3.84 -6.15 from up above. In absolute terms divided by S. Pool, which we calculated as .326879 times five times five divided by five plus five. So that gives me 7.0668. 4 times 1.58114 Multiplying them together, I get a Ti calculator, that is 11.1737. Now we have to determine if they're significantly different at a 95% confidence level. So here we need to figure out what our tea table is. So if you take out your tea tables we'd say that our degrees of freedom, remember our degrees of freedom would normally be n minus one. But when dealing with the F. Test here, the degrees of freedom actually become this N plus one plus and two minus two. So that's five plus five minus two. So that's going to be a degree of freedom of eight and we look at the great freedom of eight, we look at the 95% confidence interval. So my T. Tabled value equals 2.306. So now we compare T. Table to T. Calculated. So we're going to say here that T calculated Is 11.1737 which is greater than tea table Which is 2.306. Because of this because t. calculated it is greater than T. Table. That means we have to reject the measurements as being significantly different. So we're gonna say Yes significantly different between the two based on a 95% confidence interval or confidence level. Mhm. Now if we had gotten variances that were not equal, remember we use another set of equations to figure out what are ti calculator would be and then compare it between that and the tea table to determine if there would be any significant difference between my treated samples and my untreated samples. Remember when it comes to the F. Test is just a way of us comparing the variances of of two sets, two data sets and see if there's significant differences between them here. In terms of confidence intervals or confidence levels. We then enter into the realm of looking at T. Calculated versus T. Table to find our final answer. Yeah